Machine Learning Predictive Modeling Pipeline
Delivered a complete machine-learning lifecycle across two public datasets: a supervised stroke-prediction model (5,110 patient records, 12 features) and an unsupervised segmentation of 8,950 credit-card customers, taking both from raw data through cleaning, encoding, modelling, cross-validation and hyperparameter tuning to a fully interpreted set of results.
Business value
For clinical screening and financial analytics teams, this pipeline turns imbalanced, unstructured datasets into decision-ready risk and customer insights. In benchmark testing, tuning lifted stroke recall from 0% in the misleading high-accuracy baseline to 80%, while segmentation produced four actionable customer groups.
The problem
Two real-world problems framed the work. Clinically, around 7 million people die from stroke each year, and the value sits in identifying at-risk individuals before an event occurs — but only 249 of 5,110 records (5%) were stroke cases, so a naive model reaching 95% accuracy while catching no strokes at all was the central risk to design against. Commercially, card fraud accounts for roughly 41% of recorded crime in the UK, and banks need a defensible view of normal spending behaviour before anomalies can be flagged — with 8,950 unlabelled customer records, 314 missing values and heavily skewed balances, no target variable existed to learn from. The task was therefore to build one rigorous, reproducible pipeline that handled severe class imbalance and skewed, unlabelled financial data, and to justify every modelling decision with evidence rather than headline accuracy.
What I built
- 01
Selected and justified two public Kaggle datasets — a labelled stroke dataset (5,110 rows, 12 features, target 'stroke') for supervised learning, and an unlabelled credit-card behaviour dataset (8,950 rows, 17 features) for unsupervised learning.
- 02
Profiled both datasets with descriptive statistics and visual exploration: age was symmetric (mean 43.2, median 45), average glucose right-skewed (mean 106.1, median 91.8) and BMI slightly right-skewed (mean 28.8, median 28.1), with the 95/5 class split confirmed as the dominant modelling constraint.
- 03
Cleaned the data with SimpleImputer — median imputation for 201 missing BMI values, mean imputation for missing MINIMUM_PAYMENTS and CREDIT_LIMIT — and clipped extreme BMI and purchase outliers at sensible upper bounds and the 95th percentile.
- 04
Engineered features for modelling: one-hot encoded categorical attributes with pd.get_dummies, dropped non-predictive identifiers (id, CUST_ID) and standardised numeric features with StandardScaler inside a make_column_transformer pipeline so scaling was fitted on training folds only.
- 05
Trained supervised baselines — Logistic Regression and Random Forest — inside reproducible scikit-learn pipelines with a stratified 80/20 train-test split and class_weight='balanced' to counter the imbalance.
- 06
Diagnosed the accuracy trap directly: the untuned Random Forest scored high overall accuracy while catching zero of the 50 stroke cases, so recall on the minority class replaced accuracy as the primary evaluation metric.
- 07
Clustered credit-card customers with K-Means, using the elbow method (WCSS) and silhouette analysis to choose k = 4, and corroborated the structure with a Ward-linkage hierarchical dendrogram.
- 08
Reduced 17 behavioural features to two principal components with PCA to visualise and validate cluster separation, then profiled each cluster by balance, purchases, cash advance, credit limit and payments.
- 09
Tuned hyperparameters with GridSearchCV (5-fold) and validated stability with K-Fold cross-validation (k = 5), then compared tuned models on ROC/AUC and confusion matrices rather than raw accuracy.
- 10
Interpreted and documented the results, including honest limitations: class imbalance, sensitivity of distance-based clustering to feature scale, and residual outliers in the financial data.
Project stages
01 / 33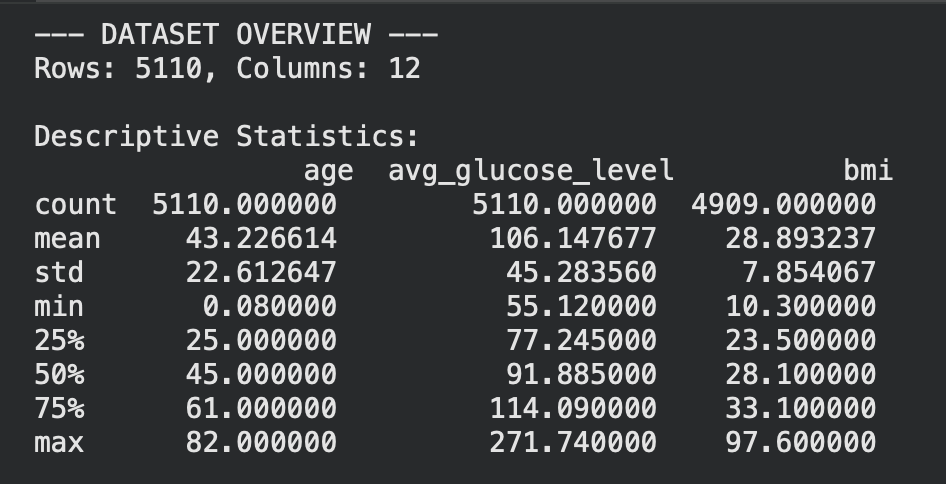
Stage 01 — supervised dataset overview: 5,110 rows, 12 columns, with descriptive statistics for age, average glucose level and BMI.