Amazon QuickSight — S3 Data Visualisation
Connected Amazon QuickSight to a Netflix titles dataset stored in Amazon S3 and built an interactive analysis: release-year distributions, movie-vs-TV-show splits, top genres and filtered views refreshed straight from the bucket.
Business value
For content and commercial analysts, this dashboard removes the need to download raw files or write one-off queries before answering routine catalogue questions. It converted 8,807 records into six decision-ready visuals in roughly two hours, creating a faster and repeatable path from source data to insight.
The problem
A 3.2 MB CSV of 8,807 titles sitting in an S3 bucket answers nothing on its own. Stakeholders needed to see trends — how output changed year on year, how movies compare to TV shows, which genres dominate — without downloading files or writing queries.
What I built
- 01
Uploaded netflix_titles.csv and a manifest.json file into a dedicated quicksight-project-arifr S3 bucket.
- 02
Edited the manifest to point at the correct S3 URI, so QuickSight could locate and correctly interpret the CSV.
- 03
Created a QuickSight account on the free trial tier and connected it to the S3 data source.
- 04
Imported the dataset into SPICE — 8,807 rows at 100% success — and confirmed schema, refresh status and access settings.
- 05
Built visuals: a donut of record counts by release year, stacked and grouped bars comparing movies, TV shows and other types per year, and a top-genres breakdown.
- 06
Applied filters and re-ran the import after updating the source file to confirm the analysis reflects live bucket data.
- 07
Assembled the visuals into a single dashboard view for at-a-glance reading.
Project stages
01 / 06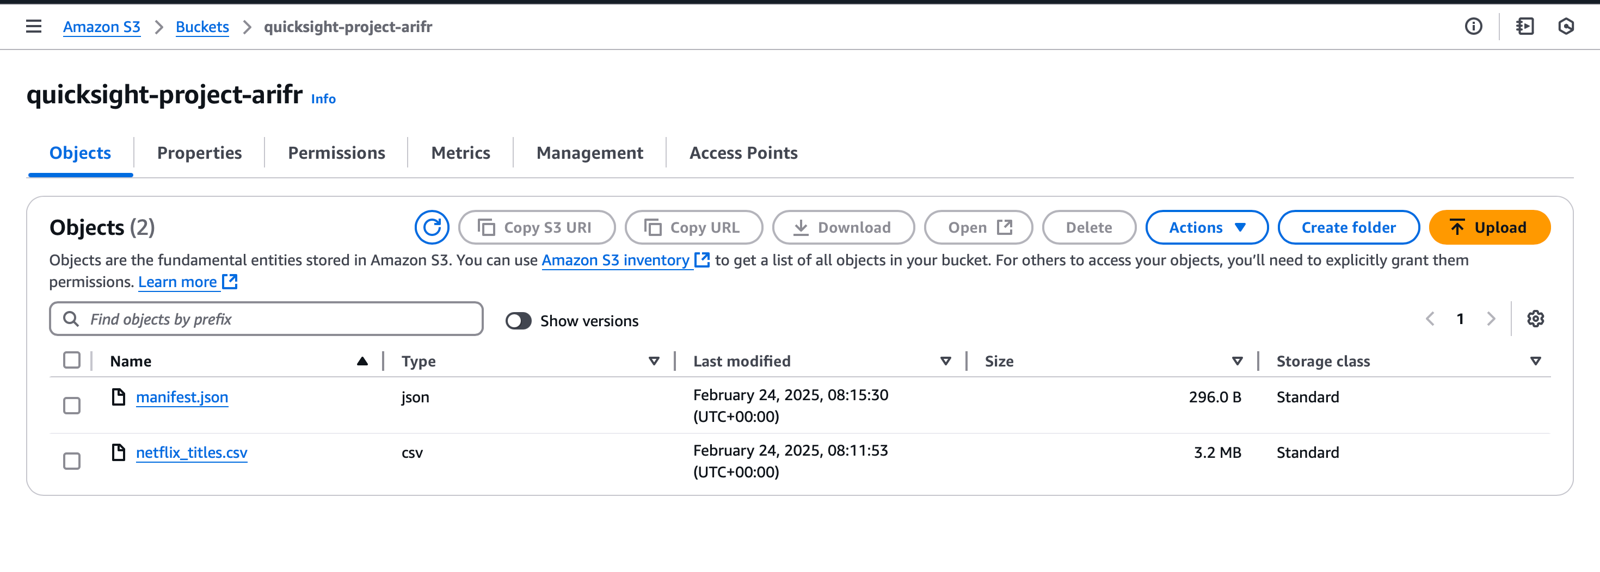
Stage 01 — the quicksight-project-arifr S3 bucket holding netflix_titles.csv and the manifest.json that tells QuickSight where the data lives.